

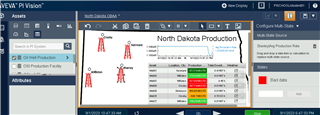
Hi. I completed challenge 01 exercise. I noticed that that the dynamic well symbols are appearing all as RED. RED stands for BAD DATA. So Dickinson, Stanley, .. Williston well symbols - all are appearing red. I checked the videos related to these exercises and I could tell that the trainer's view had valid average production rates (not bad data).
I wonder why my production rates are appearing as bad value. While this is possible, this should not be the case for a working demo.
Can anyone comment?
