人が測定している品質データのような不連続なデータを表示したいのですがどのような表示方法が良いでしょうか。
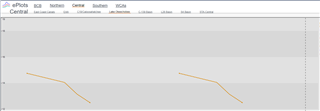
PI Visionのトレンド機能で表示すると、連続していない箇所のデータが補完され、あたかも連続データのように見えてしまいます。
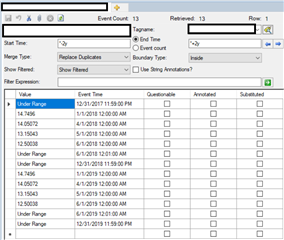
可能であれば点として表示したいです。
ご回答よろしくお願いします。
人が測定している品質データのような不連続なデータを表示したいのですがどのような表示方法が良いでしょうか。
PI Visionのトレンド機能で表示すると、連続していない箇所のデータが補完され、あたかも連続データのように見えてしまいます。
可能であれば点として表示したいです。
ご回答よろしくお願いします。